Alpha Charts Engine
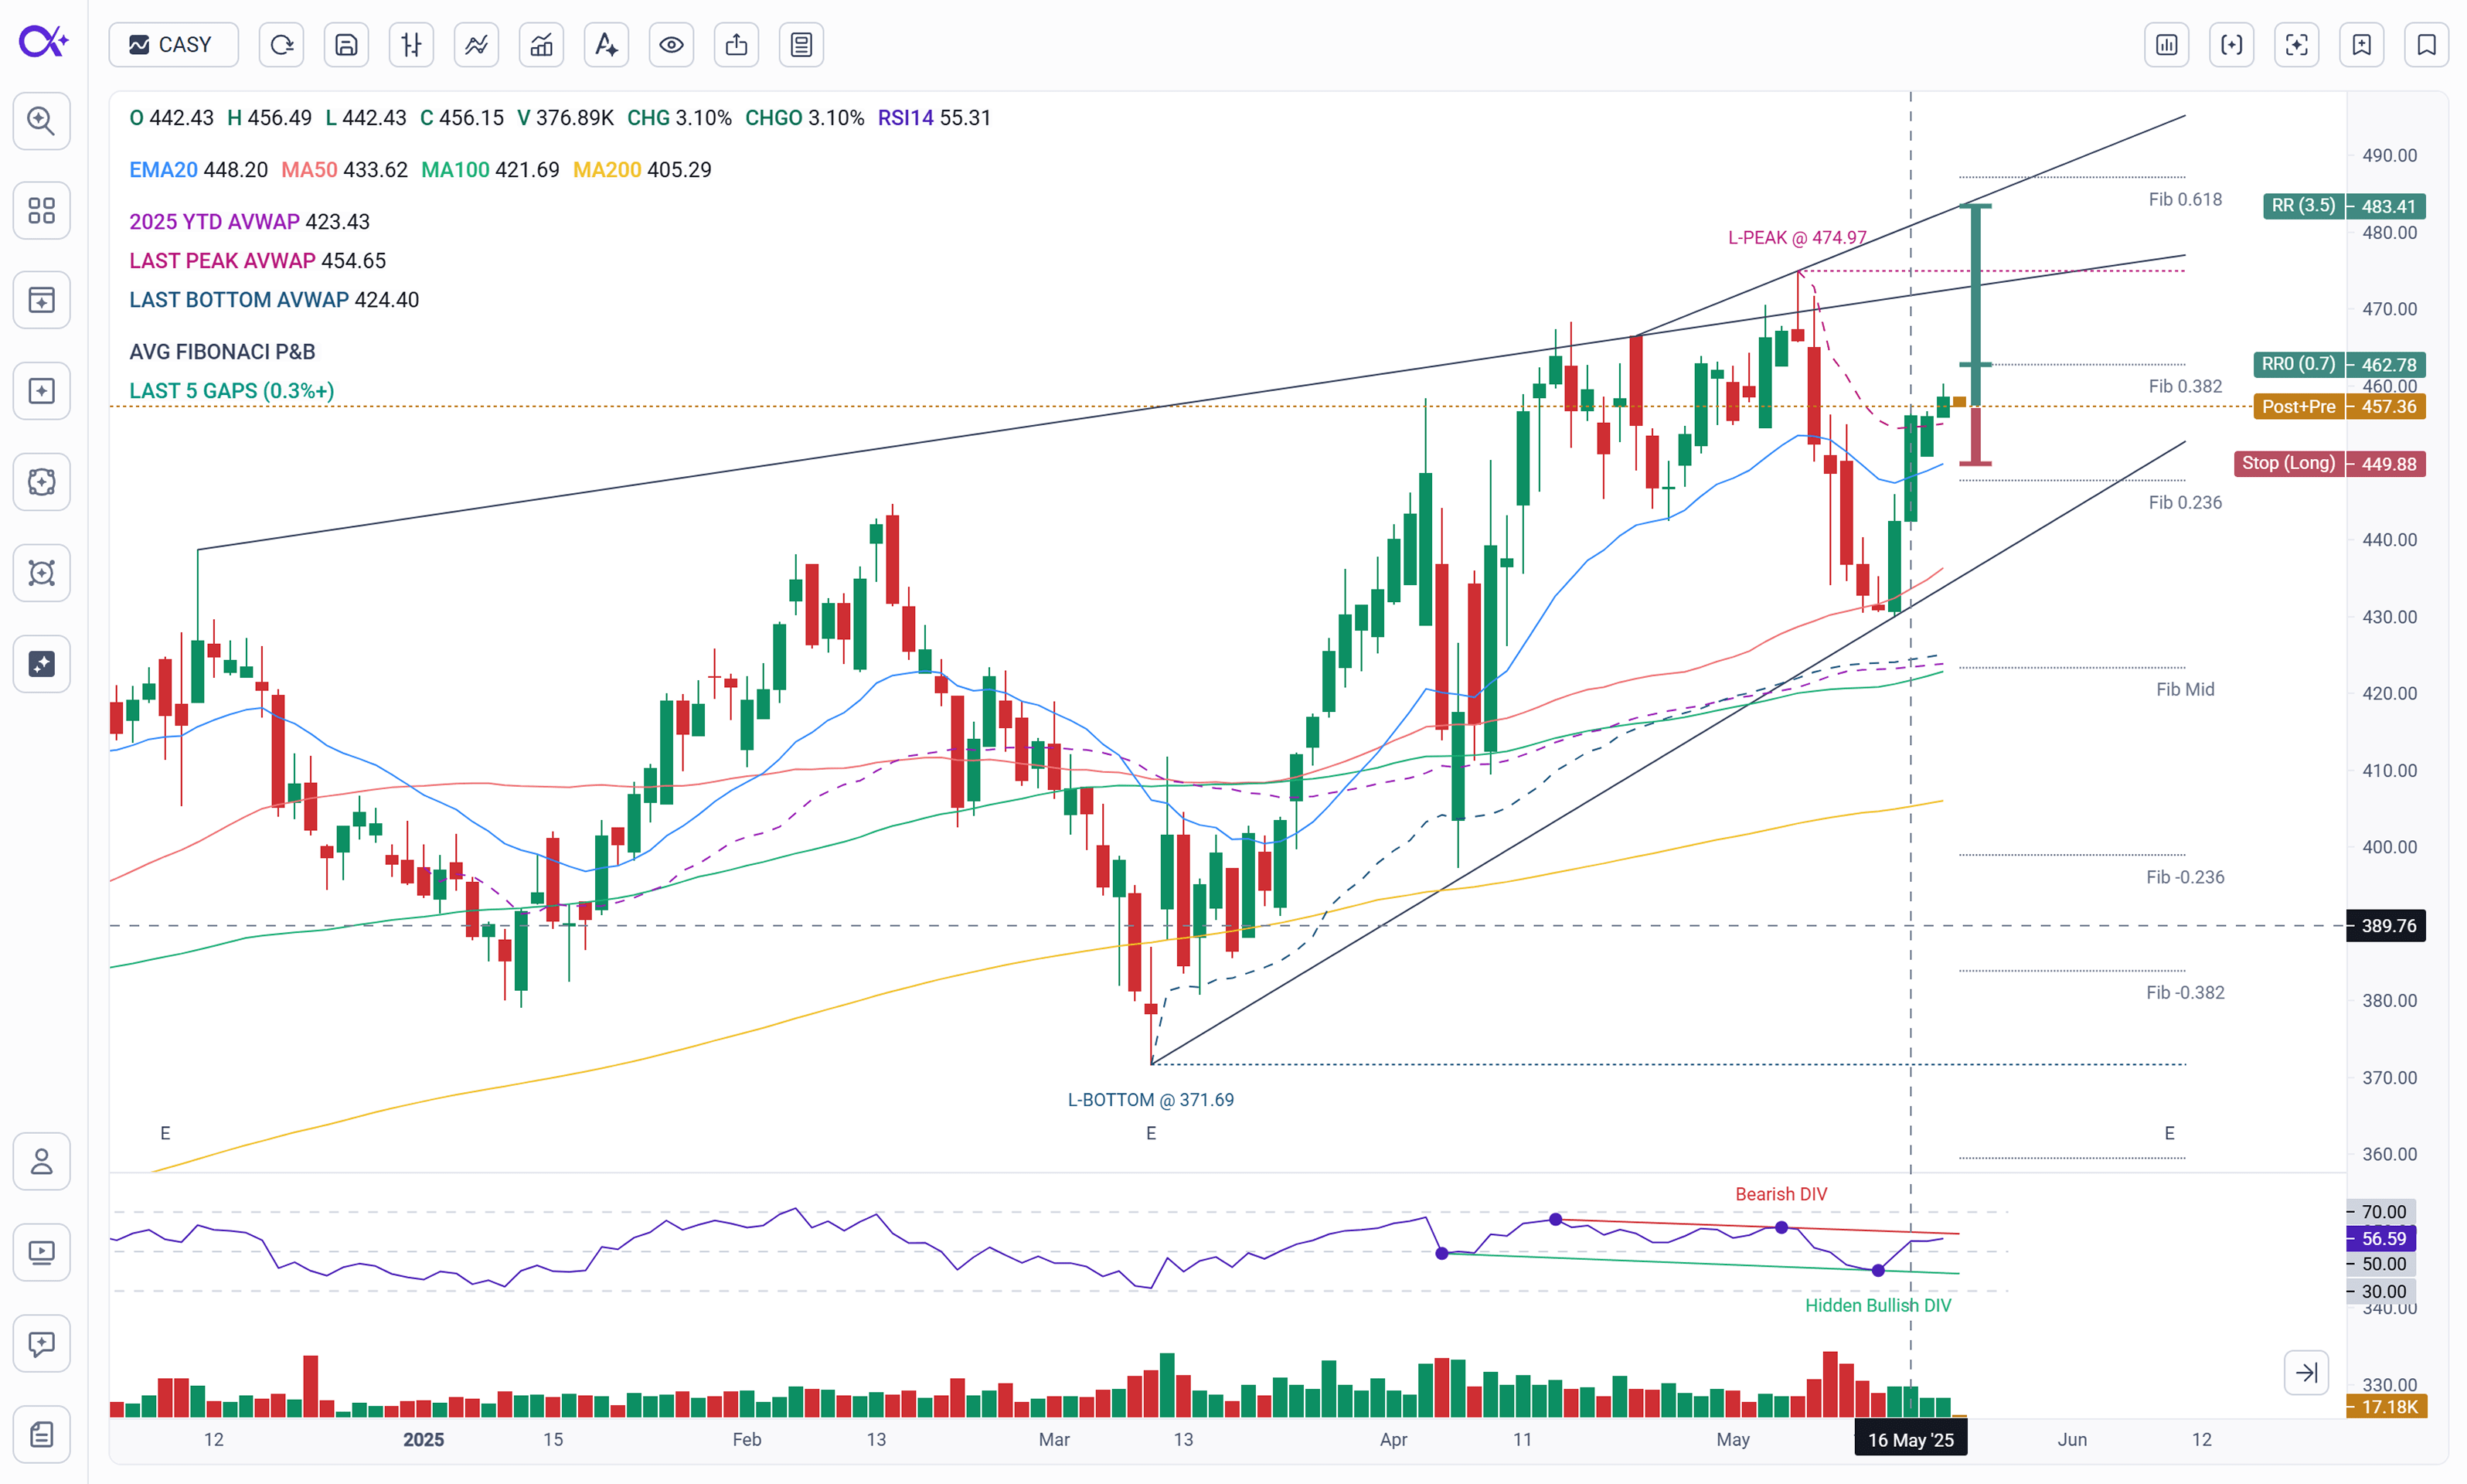
Alpha Charts deliver a fully automated charting environment designed to replicate how experienced technical analysts draw, evaluate, and plan trades — without manual input. From intelligently drawn AVWAPs and Fibonacci levels to AI-generated trendlines and divergences, every element is calculated using end-of-day price data for maximum reliability and predictive value.
At the same time, Alpha Charts also support real-time OHLCV data during regular and extended hours. This allows intraday movement, pre/post-market gaps, and risk/reward setups to update live — while still anchoring chart overlays to the most stable daily price action.
Our charts are purpose-built to eliminate the need for manual drawing and subjective interpretation. Every line, level, and label is powered by AI-driven analysis — streamlining technical decision-making while remaining transparent, screenable, and repeatable.

Accurate, Adjusted Price Data
All chart data is adjusted for corporate actions such as splits and dividends, keeping historical price action accurate and aligned over time. This ensures consistency across indicators and supports fair comparisons across different market periods.
Daily Timeframe Focus
Alpha Charts are available on the daily timeframe — widely considered the most statistically reliable view for technical analysis. Daily candles reflect full-session participation and strike a balance between trend clarity and signal stability, making them ideal for swing and multi-day trading.
Alpha Charts support both candlestick and bar chart modes, along with optional extended-hours candles that display pre- and post-market activity — giving you full control over how price action is viewed.
Indicators Update After Close
All indicators — including AVWAPs, moving averages, divergences, and trendlines — are recalculated after the regular session closes, once the final candle has settled. This prevents mid-session false signals and ensures that all levels are based on finalized price structure. By anchoring technical signals to full-session data, we improve their relevance and predictive power.
Real-Time for OHLCV and Risk/Reward
While indicators update at the close, Alpha Charts still display real-time price and volume data during regular and extended hours. This includes intraday changes to:
- Pre- and post-market candles
- Gap tracking
- Live positioning of risk/reward overlays
- Stop/target proximity calculations
This hybrid model combines stable technical foundations with live responsiveness where it matters most — such as trade timing, gap fills, or early moves into support/resistance.
Fully Searchable Visuals
Every element shown on Alpha Charts is linked directly to MarketAlpha’s screening engine. That includes:
- AI trendlines
- Anchored AVWAPs
- Support and resistance zones
- RSI-based divergences
- Recent gap levels
- Strategy overlays and R/R metrics
All of these can be filtered, ranked, and combined across thousands of tickers — allowing you to scan for setups that match your strategy with precision.
Every signal on the chart — from divergences to strategy overlays — is fully transparent and explainable. Because all indicators are calculated from visible structure and chart logic, there are no hidden signals or black-box behavior. What you see is what the AI sees, and every element is searchable across thousands of tickers.
Built-In Earnings Awareness
Earnings events are visually marked on the chart as "E" labels on the timeline. These act as alerts for recent or upcoming reports. For more context, MarketAlpha provides detailed Earnings Tables that include:
- Non-GAAP adjusted EPS and sales growth
- Acceleration and deceleration trends
- Analyst estimates and historical surprises
This integration lets you quickly evaluate whether a setup is happening before or after a major event, and dig into the fundamental drivers behind technical momentum.
Visuals Power the AI Strategy Engine
The same visuals shown on Alpha Charts — from key AVWAP levels to RSI divergences and trendline breaks — are also used as inputs to the AI Strategy Engine. This system evaluates price structure, momentum, and risk zones to:
- Recommend a directional bias (Long or Short)
- Calculate dynamic stop-loss and multi-target levels
- Compute reward/risk metrics in real time
- Determine setup quality based on structural resistance/support
Targets and stop levels generated by the strategy engine are not chosen arbitrarily — they are selected using a cluster detection model that identifies areas with overlapping support/resistance levels including major gaps, AVWAPs, and trendlines. These high-density zones are where price is most likely to react, making them ideal for defining realistic exits and invalidation points.
Every Alpha Strategy you see is rooted in these chart signals, so what appears visually is exactly what the AI is acting on — with no hidden logic or black-box behavior.
Whether you’re analyzing a single chart or screening thousands of tickers, Alpha Charts act as a visual command center — connecting structure, momentum, and strategy into a unified, real-time system.
Disclaimer: MarketAlpha’s charting engine is built with Lightweight Charts™ by TradingView — an industry-leading visualization library known for its performance, clarity, and adaptability. MarketAlpha is not affiliated with or endorsed by TradingView. Lightweight Charts are trademarks of TradingView, Inc.