Heat Maps
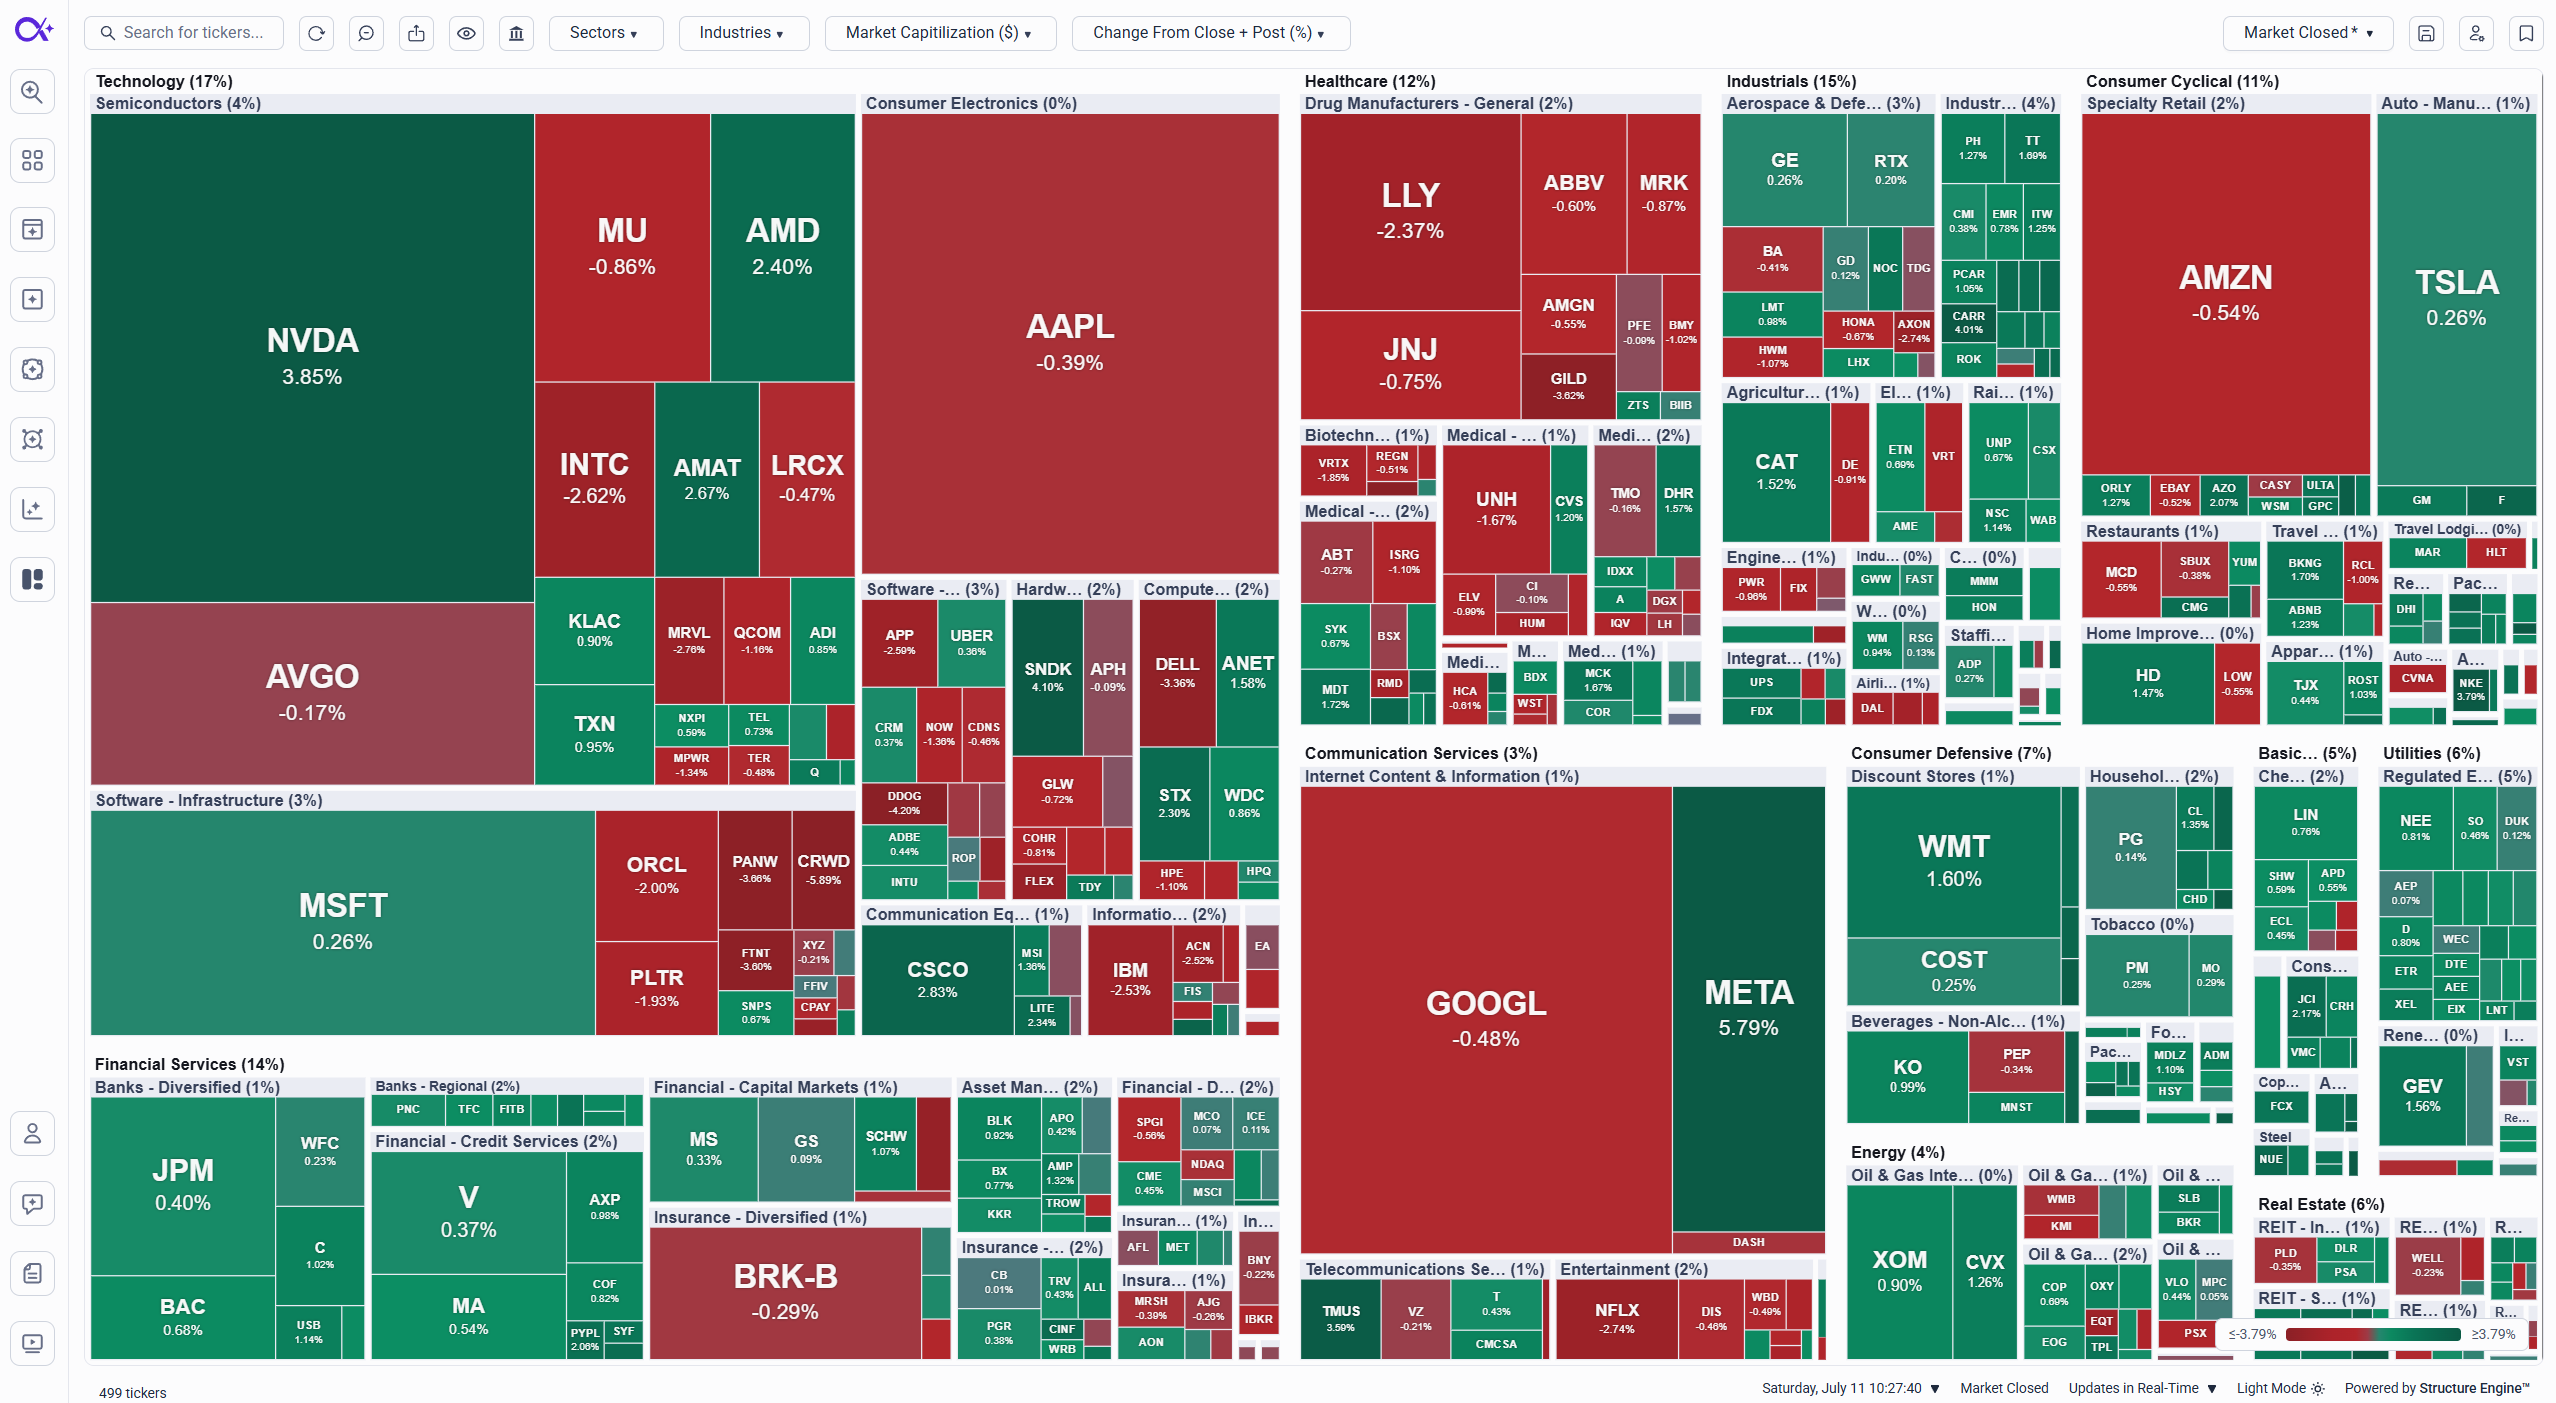
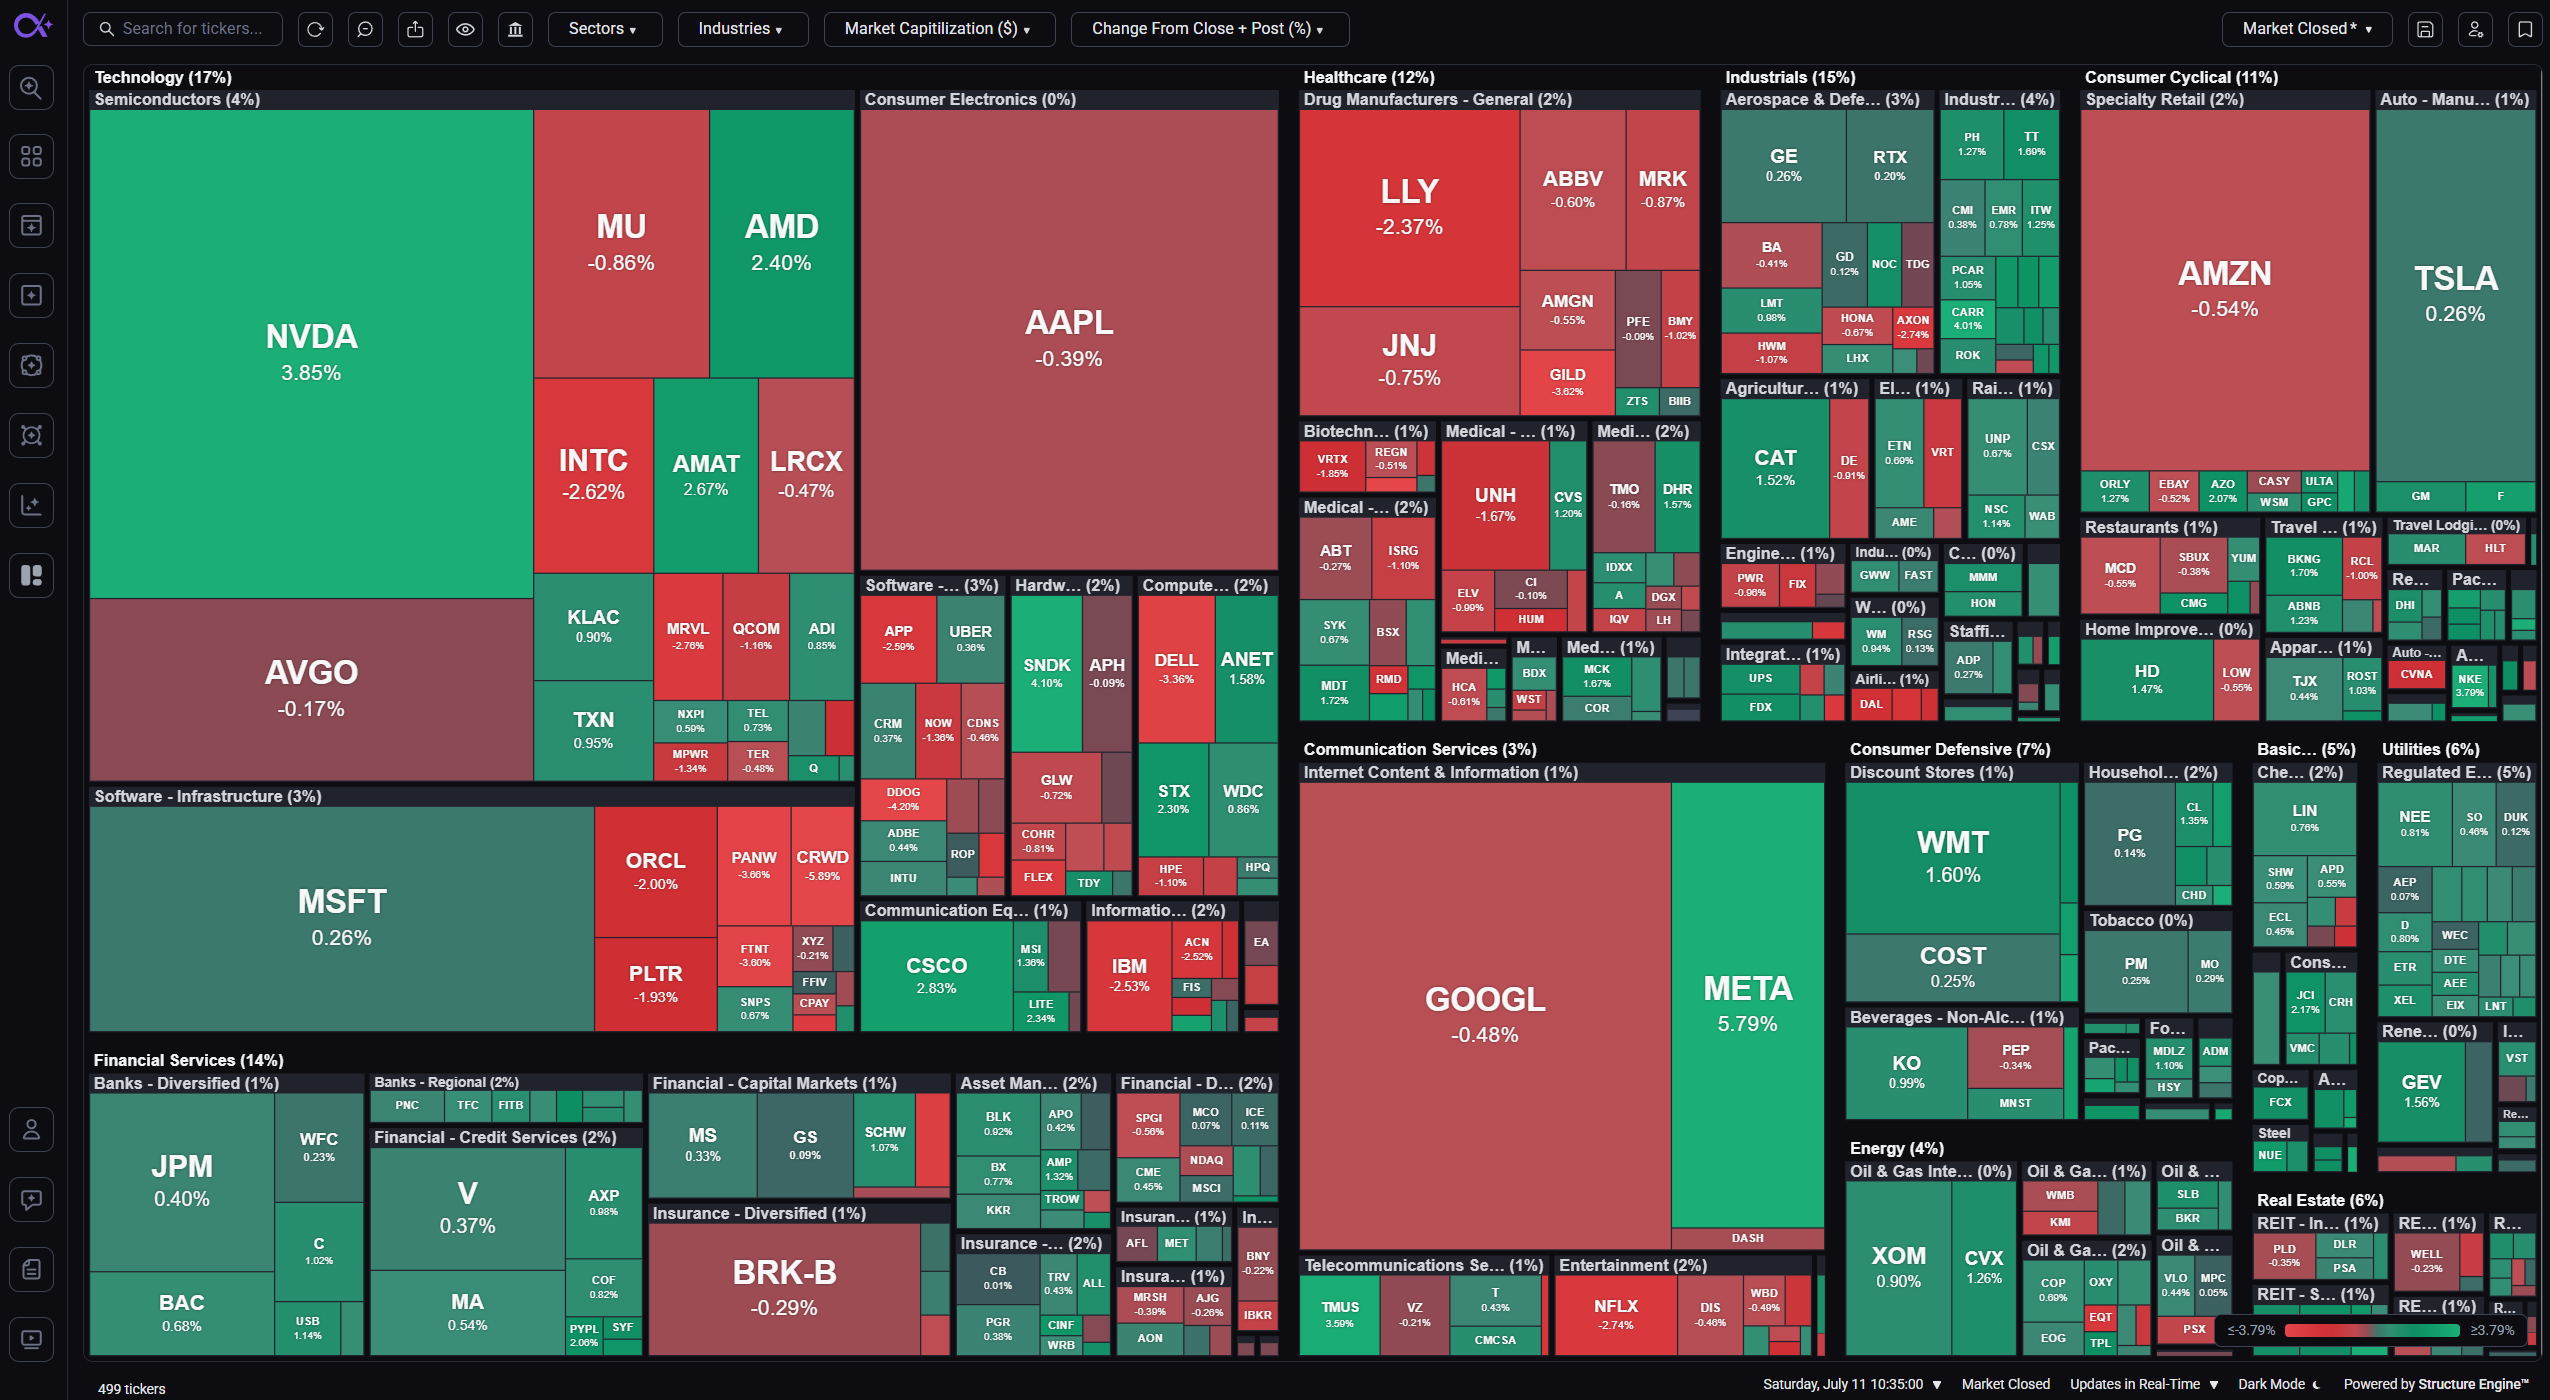
Heat Maps show you the whole market on one screen. Every ticker is a box on an interactive map: boxes are grouped by a category you choose (like sector or theme), sized by one metric (like market cap), and colored by another (like daily change) — so you can spot where money is moving at a glance.
How to Open
- Use the Main Navigation Bar → Click Heat Maps
- Open one of your favorite Heat Map profiles directly from the navigation
Clicking Heat Maps in the navigation while already on the page resets the map back to the default view for the current market session.
What You'll See
- A live map of the market, laid out as groups of boxes — one box per ticker
- Group headers showing each group's name, ticker count, and share of the map
- A color legend explaining the current color scale
- A top toolbar for search, display options, categories, metrics, and profiles
- A profiles dropdown, Save button, and sidebars for profiles and watchlists on the right
The map updates with live market data, and the color scale adapts automatically so moves stay easy to read on both quiet and volatile days.
Reading the Map
- Box size reflects your chosen Box Size metric — bigger box, bigger value. You can also switch to Same Size Boxes to give every ticker equal weight.
- Box color reflects your chosen Box Color metric — for example, green for gainers and red for decliners when coloring by daily change.
- Groups come from your Main Category, optionally split further by a Sub Category (for example, Sectors split into Industries).
Interacting with the Map
- Scroll to zoom and drag to pan around the map
- Hover any box for a tooltip with the ticker's details
- Search for a ticker in the toolbar — the map zooms straight to its box and highlights it
- Click a ticker box to open it in the chart sidebar
- Click a group header to open that group's tickers in Multi-Charts
- Right-click a box (or long-press on touch devices) for more options: open in Multi-Charts, open in Ticker Viewer, or add to a watchlist
- Use Reset Zoom to return to the full map, or Reset Heatmap to restore the default layout
Export and Share
Use the export button in the toolbar to download the current view as an image or copy it to your clipboard — ready to share exactly as you see it.
Summary
Heat Maps turn thousands of tickers into one readable picture of the market. Start with a ready-made profile, zoom into the groups that stand out, and jump straight into charts, viewers, or watchlists — all without leaving the map. To shape the map to your own workflow, see Customizing the Heat Map and Heat Map Profiles.